
Chart patterns and indicators in technical analysis
549 Views
Trading and investing are art forms in which the canvas is the market, and charts are the primary colours used to paint the picture of price movements. Technical analysis is at the core of this creative process, a crucial tool for traders and investors, particularly in the UK. The practice of technical analysis is both an intricate and rewarding one; it involves the study of various chart patterns and indicators to uncover trends, predict market direction, and identify opportunities.
This article will delve into the multicoloured palette of chart patterns and technical indicators, providing UK traders with insights and strategies to enhance their trading journey. Whether you’re a seasoned trader or just starting, understanding and utilising these analytical tools can mean the difference between a prosperous trade and a missed opportunity.
Understanding chart patterns
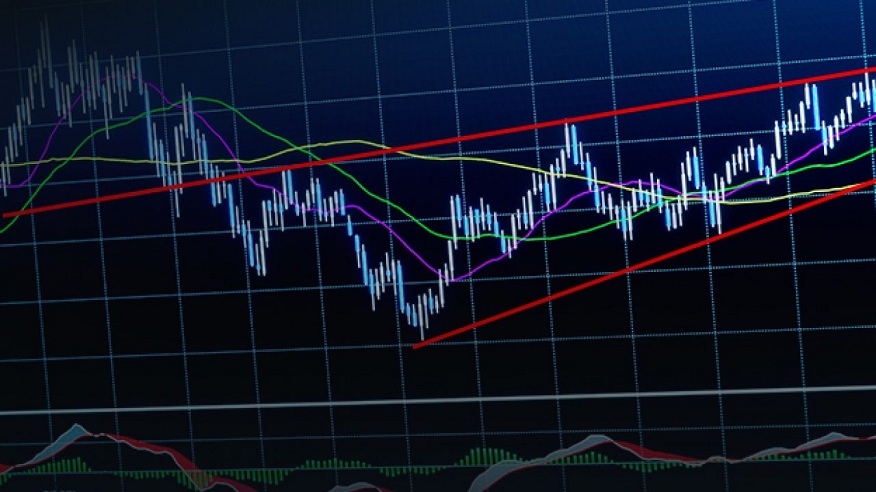
Chart patterns are the various shapes the price forms on a chart, which traders use to predict the market’s future direction. These patterns reflect the underlying psychology of the market participants and often signal potential changes or continuations in market trends.
Chart patterns demystified
The head and shoulders pattern, the double top/bottom, and flags and pennants are some of the most common chart patterns traders in the UK rely on. For instance, the head and shoulders pattern typically indicates a trend reversal and consists of three peaks (head and shoulders), with the middle one being the highest and the two outside ones lower. It suggests a peak that a significant downswing could follow in the market.
Identifying these patterns involves an understanding of price action and trend lines. Each pattern has specific criteria for validation, and mastering these can significantly improve a trader’s likelihood of success. You can consult a broker such as Saxo to help you learn and apply these patterns in your trading strategy.
The art of pattern recognition
To profit from chart patterns, traders must proactively spot potential formations, which involves regularly scanning charts, setting price alerts, and using specific pattern recognition tools. Once a pattern is identified, traders often rely on it to set entry and exit points and place stop-loss orders.
Chart patterns visually represent the market sentiment, making it intuitive and easy to understand for many traders. However, they should always be used in conjunction with other forms of analysis to confirm signals.
Examining technical indicators
Technical indicators are calculations based on the price, volume, or open interest of a security or contract used to predict market direction and overall market strength. Traders and investors use indicators to understand market trends and identify areas of support and resistance.
The ‘indicator’ caster
Indicators such as moving averages, the Relative Strength Index (RSI), and the Moving Average Convergence Divergence (MACD) are indispensable in a UK trader’s toolkit. The moving average, for example, gives an average closing price for a specified period, smoothing out short-term price fluctuations and offering a better understanding of the overall trend.
Each indicator serves a specific purpose, be it measuring momentum, volatility, or the force behind price movements. Understanding these tools is vital to making informed trading decisions.
Leveraging the power of indicators
Traders can harness the power of indicators by using them to confirm or refute trading signals. For instance, if a chart pattern suggests a bullish trend, a trader might look towards the RSI to ascertain whether the market is becoming overbought. If the RSI is high, a reversal might be on the cards.
It’s crucial to avoid overloading charts with too many indicators, which can lead to analysis paralysis. Select a few that complement your trading style and focus on mastering their application.
Examples of technical analysis tools
In addition to chart patterns and technical indicators, other tools like Fibonacci retracements, candlestick charts, and Bollinger Bands can provide valuable insights to UK traders.
Fibs for financial forecasting
Fibonacci retracements are based on the mathematical sequence discovered by 13th-century mathematician Leonardo Fibonacci. These levels indicate potential areas of support or resistance where price reversals may occur. Many traders use these retracements to determine entry and exit points for trades.
Candlesticks
Candlestick charts are a popular visual representation of price movements, consisting of ‘candles’ with wicks (shadows) and bodies that indicate the opening, closing, high, and low prices for a specific period. These charts are particularly useful in determining market sentiment and identifying potential reversals.
Bands to bound prices
Bollinger Bands, developed by John Bollinger, use moving averages and standard deviations to create upper and lower bands encompassing price fluctuations. These bands indicate volatility, with wider bands showing higher volatility and narrower bands suggesting low volatility.
Conclusion
The journey into technical analysis for UK traders is continuous learning and adaptation. While chart patterns and indicators provide valuable insights, they should not be the basis of trading decisions. Consider the broader market context, including fundamental analysis, economic events, and geopolitical factors.
The keys to success lie in disciplined practice, patience, and the willingness to refine and develop one’s trading strategy constantly. As you continue your trading and investing journey, experiment with different patterns and indicators, identify what works best for you, and build a personalised approach that aligns with your risk tolerance and financial goals.
a